
")
Introduction
Global markets are experiencing heightened volatility as geopolitical tensions impact commodities, currencies, and stock indices.
In today’s IVG Market Blast, Brad Alexander examines the latest developments in oil markets, gold price action, and the broader equity market.
This analysis focuses on key instruments including:
-
West Texas Intermediate (WTI)
-
Brent Crude
-
Gold (XAUUSD)
-
S&P 500
Let’s take a closer look at how geopolitical tensions are influencing price action across these markets.
Watch the Full Market Analysis
Oil Prices Surge as Supply Risks Increase
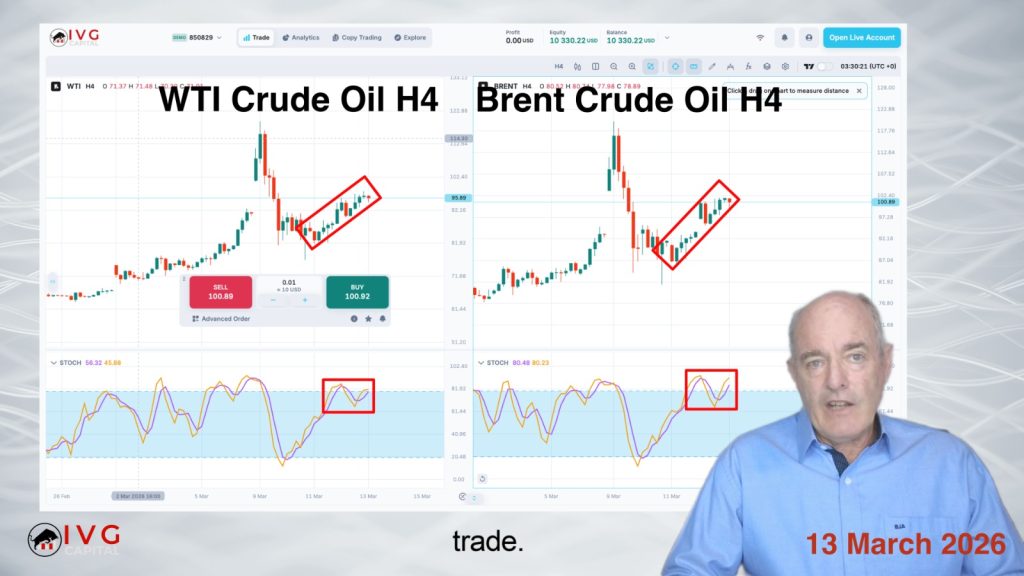
Oil markets have rallied significantly following geopolitical tensions and supply concerns linked to the Iran conflict.
Both WTI and Brent crude experienced a sharp rise in prices earlier this week. At one point, the price difference between these two global oil benchmarks nearly disappeared — a rare event in energy markets.
Typically, Brent crude trades at a premium compared to WTI because it represents a larger portion of globally traded oil and is closer to major international markets.
Recent tanker attacks in the Strait of Hormuz have created fears of supply disruptions, pushing oil prices higher.
Although technical indicators suggest the market may be overbought, oil prices are currently being driven primarily by geopolitical news rather than traditional technical trading signals.
Gold Forms a Descending Triangle Pattern
Gold (XAUUSD) remains a key focus for traders during times of uncertainty.
After previously trading within a range, gold price action is now forming a descending triangle pattern with support around the $5,060 level.
This technical formation often signals a potential breakout, but the direction remains uncertain.
Technical indicators show mixed signals:
-
The stochastic oscillator indicates oversold conditions on longer time frames.
-
On shorter time frames, the oscillator shows overbought conditions suggesting a potential reversal.
Because of these conflicting signals, traders may want to wait for clearer price confirmation before entering new positions.
S&P500 Approaches Upper Trend Line
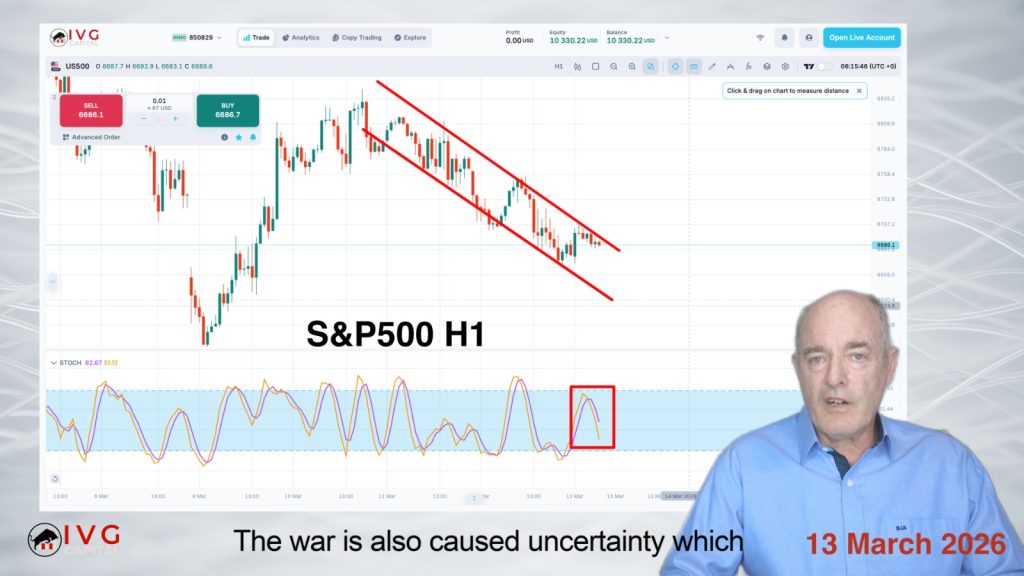
Equity markets have also been affected by global uncertainty.
The S&P500 index is currently approaching the upper boundary of a descending trend line, an area that could act as resistance.
Technical indicators suggest the market may be entering overbought territory, which could increase the likelihood of short-term volatility.
Periods of geopolitical tension often create rapid market movements, and traders should remain cautious when evaluating potential opportunities.
Economic Data to Watch
Several major economic releases scheduled today could influence market volatility across currencies, commodities, and stock indices.
Important economic events include:
-
UK GDP data
-
Canadian employment figures
-
US PCE Price Index
-
US GDP data
-
US Job Openings reports
These indicators may significantly impact global financial markets and trading sentiment.
Final Thoughts
Oil prices remain highly sensitive to geopolitical developments, while gold continues to show mixed technical signals.
At the same time, the S&P500 is approaching a key technical resistance level that traders should monitor closely.
In volatile environments like this, both technical analysis and geopolitical developments play a crucial role in shaping market direction.
Risk Disclaimer
CFDs and FX are leveraged products and trading them involves significant risk. Your capital may be at risk. This analysis represents market observations and should not be considered trading advice.