
")
Introduction to Oil Volatility Gold Silver AUDUSD
The Oil Volatility Gold Silver AUDUSD scenario is driving major movements across commodities and forex markets.
In this update, we analyze price action in Brent Crude, West Texas Intermediate (WTI), Gold (XAUUSD), Silver (XAGUSD), and AUDUSD.
Conflicting geopolitical headlines are creating sharp reversals in oil prices, while technical indicators are signaling potential weakness in precious metals and key currency pairs.
Watch the Full Market Analysis
Oil Volatility Gold Silver AUDUSD: Oil Drops Then Reverses
The Oil Volatility Gold Silver AUDUSD theme is clearly visible in crude oil markets.
Prices initially fell following news of possible peace talks, but quickly reversed as conflicting updates created uncertainty.
Both Brent and WTI crude oil remain highly sensitive to geopolitical developments, especially those affecting supply routes like the Strait of Hormuz.
This type of price behavior highlights how fundamental news can override technical signals in the short term.
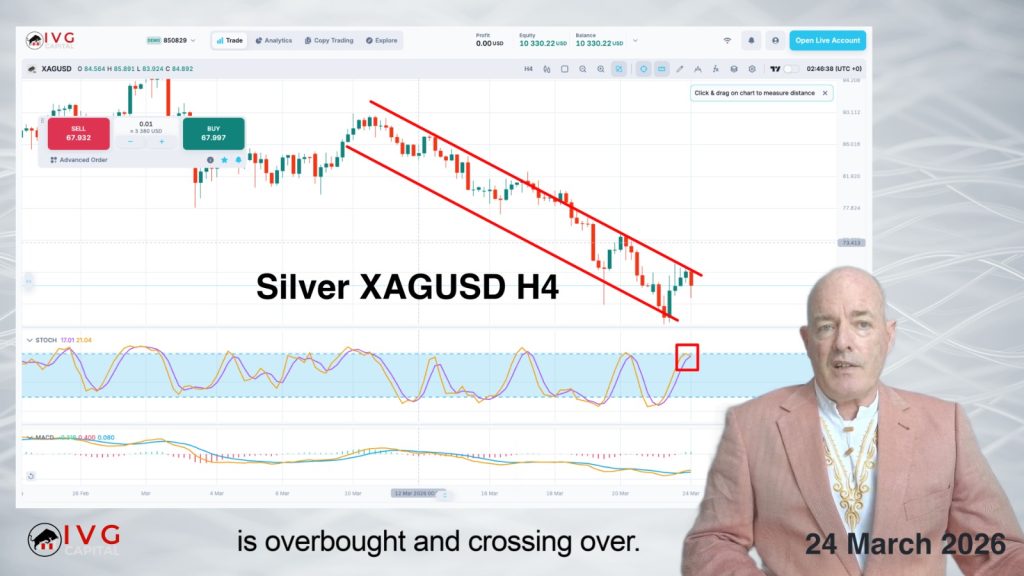
Silver XAGUSD Shows Bearish Signals
Silver (XAGUSD) is currently displaying strong bearish technical signals.
On the 4-hour chart:
-
Price action is moving within a downward channel
-
The stochastic oscillator is overbought and turning down
-
MACD is showing bearish momentum
On the daily chart, price action is forming a descending triangle, with support around $67.
This suggests potential continuation to the downside unless a breakout occurs.
Gold XAUUSD Mirrors Silver Weakness
Gold (XAUUSD) is showing a similar technical structure to silver.
After falling from the key psychological level of $5,000, price action is now showing:
-
Overbought stochastic crossover
-
Bearish MACD signals
-
Weak momentum at higher levels
Gold and silver often move together, so traders should monitor both assets closely for confirmation signals.
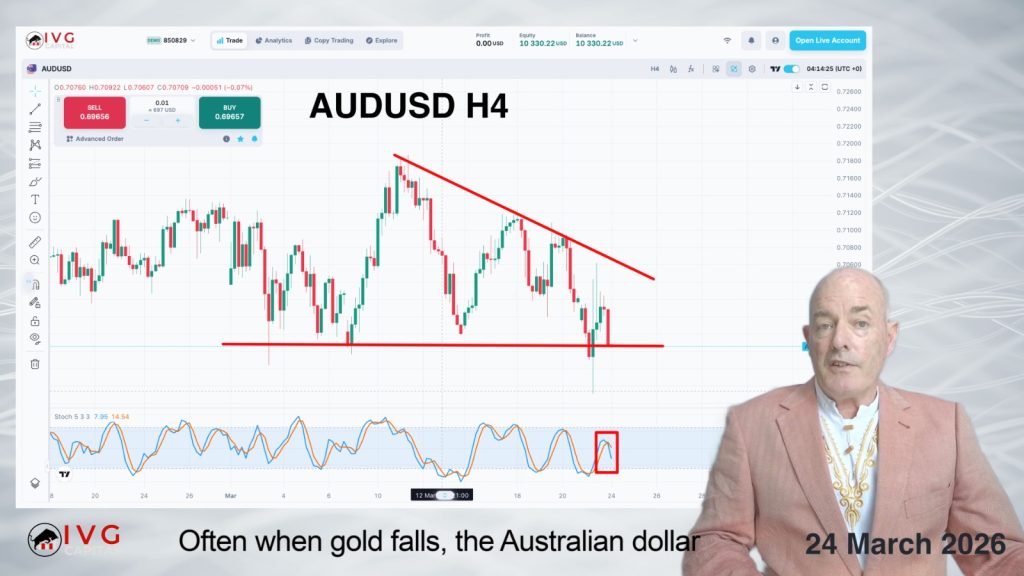
AUDUSD Descending Triangle Setup
AUDUSD is also under pressure, forming a descending triangle near a key support level.
This pattern typically indicates:
-
Consolidation within a range
-
Potential breakout to the downside
Additionally, there is a strong correlation between gold and the Australian dollar, which explains why AUDUSD is weakening alongside falling gold prices.
Upcoming economic data, including Australian CPI and US Unemployment Claims, could act as catalysts for a breakout.
Key Technical Indicators to Watch
Several technical tools are helping traders analyze current market conditions:
-
Stochastic Oscillator for overbought/oversold signals
-
MACD for momentum direction
-
Fibonacci Retracement Levels (38.2% and 50%)
-
Trendlines and Chart Patterns (channels and triangles)
These indicators provide valuable insights when combined with fundamental analysis.
Final Thoughts on Oil Volatility Gold Silver AUDUSD
The Oil Volatility Gold Silver AUDUSD environment highlights the importance of combining technical analysis with real-time news.
Oil markets remain highly reactive to geopolitical developments, while gold, silver, and AUDUSD are showing signs of technical weakness.
As volatility continues, traders should stay cautious, monitor key levels, and remain aware of upcoming economic events.
Risk Disclaimer
CFDs and FX are leveraged products and trading them involves significant risk. Your capital may be at risk. This content is for educational purposes only and should not be considered financial advice.